
Viewing Cloudflare bandwidth and Edge Analytics in the webcentral.au Dashboard
Learn how to view Cloudflare bandwidth and Edge Analytics in the Webcentral Dashboard.
To view Cloudflare bandwidth and Edge Analytics in the Webcentral Dashboard, follow these steps:
- Log in to the Webcentral Panel at https://theconsole.webcentral.au/
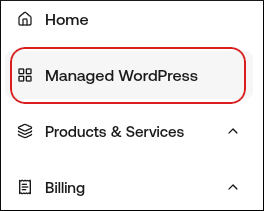
- In the left sidebar, click Managed WordPress:
- On the My Websites page, locate the site, and then click Manage

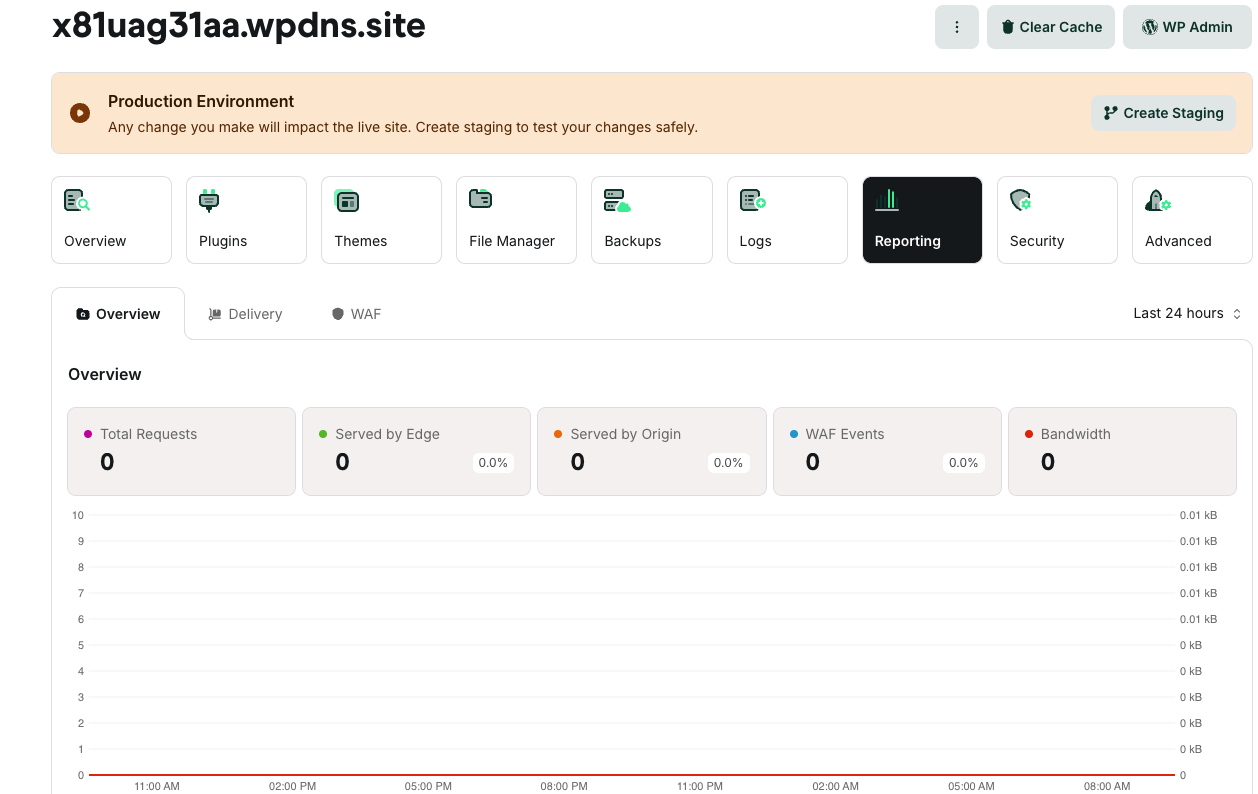
- On the Webcentral dashboard, click the Reporting icon:
- On the Overview tab, at the top right, in the Last 24 hours list box, select the amount of time covered in the bandwidth chart:
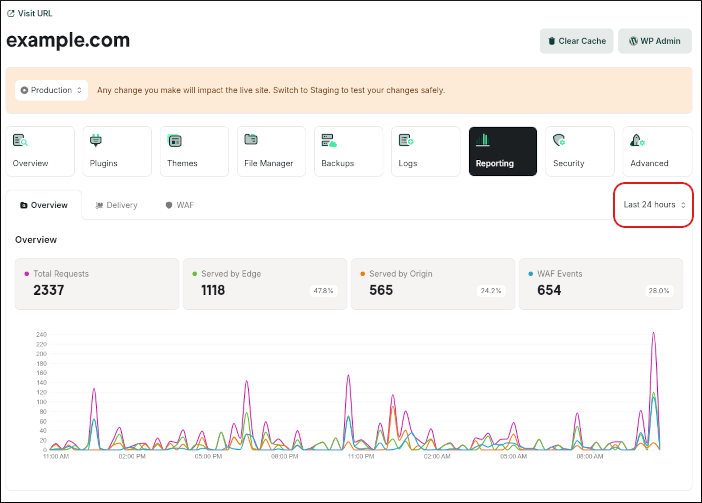
- To view bandwidth use for a specific day, hover over that date on the chart itself to see the exact amount used.
- Keep scrolling down to view analytics from Cloudflare’s Edge network to gain a greater understanding of the traffic going to your site from Cloudflare’s perspective.
Note
- For more information about these statistics, go to What is the difference between visitors on the Webcentral Dashboard and pageviews on Google Analytics?.
- For more information about Cloudflare Edge Analytics, go to https://rocket.net/blog/cloudflare-edge-analytics-for-wordpress/.
Updated 4 months ago